|
Slope Zone Maps |
|
There are a great variety of thematic maps that can be created. One such
map is that of slope categories. The U.S. Geological Survey developed
some experimental maps of slope. These maps have been made from
topographic maps.
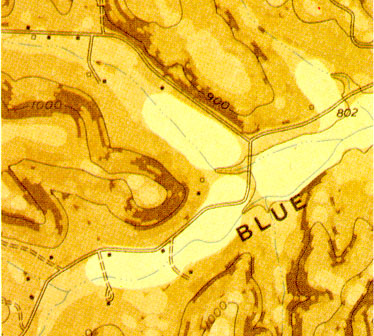
Below is a portion of one of their experimental maps. In this example, the slope zone categories are printed over the topographic map base. Look close and you can see the hypsographic, hydrographic and transportation features. |
|
|
The text Elements of Cartography, 6th ed., by Robinson, Morrison, Muehrcke, Kimerling and Guptill has a discussion of this map type with examples in black and white. They identify this map type as a morphometric map, a map that gives quantitative information about the landform. (p. 536) The example shown here is based on the 1:24,000 topographic quadrangle. The easiest way to make a map of this type is to use a Digital Elevation Model in a GIS. This map can also be constructed by hand using a paper topographic map. To make such a map you would first set up slope categories. Start by identifying the steepest slope on the map. Do this by looking where the contours are closest together. Then you must decide what is the smallest mappable feature, that is, how small a patch of ground will be shown as a separate slope zone? In the map above there are a few small brown dots showing steep slope areas. (Note: do not confuse the black dots identifying buildings.) The smallest mappable unit can be no smaller than the physical distance between two contours. In most cases the smallest unit should probably be larger than the smallest distance between the two closest contours. Below is the legend for the slope zone map above. In this legend the steepest slopes are greater than 50%. We are not told what the steepest slope is. The lowest slope is 0%, or flat. |
|
|
Note the good graded series of colors in this legend. The steepest slopes are a dark brown and the most gentle slopes a light cream. Also note the classes, which are not uniform.
To make a map of this type from a paper topographic map, find the steepest slopes and set up the number of slope categories you want. Then pick out a graded set of colors. Start compiling the map by identifying all areas with the steepest slopes. These could be delineated on an overlay or copy of the map. Then color in the areas with the steepest slopes. Then identify the areas that fall into the next steepest categories of slope and color those areas in. Keep doing that until the map is done. Make certain you have a legend showing what the colors represent. The author of this page, Professor James R. Carter, produced a series of slope zone maps for the Great Smoky Mountains National Park. Those maps were based on 3 arc-second DEMs, which were constructed from the 1:250,000 topographic map series. The paper based on this work is:
|
|
|
